Break Points & Population Pull according to the Gravity Model
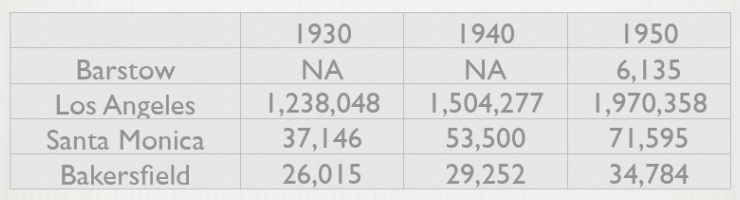
Population Growth. Breakpoints were calculated from these figures as it was based on population pull.
Source: Census.gov
Analysis Santa Monica lies at the intersection of Highway 1 (PCH) and the end point of Route 66. This a crucial point in its development since much of the population draw was a result of regional growth nexuses that characterize much of Southern California. Situated on the end point of Route 66, Santa Monica’s growth as attributed to the Dust Bowl can be used to analyze the city’s “Sphere of Influence” through looking at the spatial interactions.
It was during the Dust Bowl that Santa Monica’s population increased by thirty percent, from 37,146 in 1930 to 53,500 in 1940. (William) (Refer to Chart 1) The great migration westward towards Southern California was a result of migrational chains’ snowball effect for economic intentions. (Carter) Los Angeles County, at the time, was still mainly agricultural, and the “Okies” that moved there were farmers who left the Southwest to find better prospects. Much of the struggle in this period America’s history can be understood through the Grapes of Wrath, a novel by John Steinbeck, where the Dust Bowl had ravaged the lower midwest and the consolidation of farms pushed individual farmers off the land. (William) At the center of this large migration however is a question of where to settle. Tenants and small land holding farmers had a migratory habit, thus developing a root of rationality of simply seeking greater opportunities. (William) Utilizing the Gravity Model to analyze the potential migration capture of two cities, one can calculate the level of attraction of each city, namely their “Sphere of Influence,” in a historical context. To organize the rationality of the migrants, Bakersfield is chosen as the alternative as it is the largest central valley city and the weight distance is square due to road conditions and the technology of cars in the 1930s. |
With the center point as Barstow and data taken from the 1930s Census, Bakersfield’s attract-ability is 9,443 as compared to the attract-ability of Santa Monica at 17,232. (The City of Barstow was incorporated in 1947, therefore, the census data taken is from the 1950s.)
These figures are cogent as Santa Monica’s population is higher than that of Bakersfield, but they are more comparable in size than that of Los Angeles. For reference, Los Angeles’ draw is 697,825 as its population in the 1940s was already more than 1.5 million. (Refer to Chart 1) In the first comparison, the attraction was based purely on the population density, as Santa Monica’s population was about eleven thousand more than Bakersfield, likely due to WPA projects being funded within the city and its proximity to Los Angeles. A particular trend that is notable is Santa Monica’s connection with Los Angeles. With both cities sharing a border, the relationship of these two cities is vital to understanding the social political side of their trade areas and “spheres of influence.” According to Reilly’s Law of Retail Gravitation, the two sides of the Break Point, or the boundary, is the defined trade area of the first city. In this formula, the first city will be Santa Monica. In calculating the change over time, the 1940s census data and the 2012 estimated population is used to compare the fluctuation of retail gravity in relation to Los Angeles. Santa Monica has a trade area radius of 14.49 miles in 1940 and a trade area radius of 14.65 miles in 2012. Despite its smaller size and a smaller growth in population, the trade area has only fallen by a little in seventy years; Santa Monica has clearly been able to remain unfettered by the neighboring megalopolitan that is Los Angeles. References: Carter. The Process of Urbanization. 1995. (accessed February 13, 2014). Mullins, William. "Encyclopedia of Oklahoma History & Culture." Oklahoma Historical Society. http:// digital.library.okstate.edu/encyclopedia/entries/o/ok008.html (accessed February 13, 2014). |
